Cluster metrics
We're going to explore how to enable CloudWatch Container Insights metrics for an EKS cluster with the ADOT Collector. The first thing we'll need to do is create a collector in our cluster to gather metrics related to various aspects of the cluster such as nodes, pods and containers.
You can view the full collector manifest below, then we'll break it down.
Expand for full collector manifest
apiVersion: opentelemetry.io/v1beta1
kind: OpenTelemetryCollector
metadata:
  name: adot-container-ci
  namespace: other
spec:
  image: public.ecr.aws/aws-observability/aws-otel-collector:v0.40.0
  mode: daemonset
  serviceAccount: adot-collector-ci
  config:
    receivers:
      awscontainerinsightreceiver:
        add_full_pod_name_metric_label: true

    processors:
      batch/metrics:
        timeout: 60s

    exporters:
      awsemf/performance:
        namespace: ContainerInsights
        log_group_name: "/aws/containerinsights/${EKS_CLUSTER_NAME}/performance"
        log_stream_name: "{NodeName}"
        resource_to_telemetry_conversion:
          enabled: true
        dimension_rollup_option: NoDimensionRollup
        parse_json_encoded_attr_values: [Sources, kubernetes]
        metric_declarations:
          # node metrics
          - dimensions: [[NodeName, InstanceId, ClusterName]]
            metric_name_selectors:
              - node_cpu_utilization
              - node_memory_utilization
              - node_network_total_bytes
              - node_cpu_reserved_capacity
              - node_memory_reserved_capacity
              - node_number_of_running_pods
              - node_number_of_running_containers
          - dimensions: [[ClusterName]]
            metric_name_selectors:
              - node_cpu_utilization
              - node_memory_utilization
              - node_network_total_bytes
              - node_cpu_reserved_capacity
              - node_memory_reserved_capacity
              - node_number_of_running_pods
              - node_number_of_running_containers
              - node_cpu_usage_total
              - node_cpu_limit
              - node_memory_working_set
              - node_memory_limit

          # pod metrics
          - dimensions:
              [
                [FullPodName, PodName, Namespace, ClusterName],
                [PodName, Namespace, ClusterName],
                [Service, Namespace, ClusterName],
                [Namespace, ClusterName],
                [ClusterName],
              ]
            metric_name_selectors:
              - pod_cpu_utilization
              - pod_memory_utilization
              - pod_network_rx_bytes
              - pod_network_tx_bytes
              - pod_cpu_utilization_over_pod_limit
              - pod_memory_utilization_over_pod_limit
          - dimensions:
              [
                [FullPodName, PodName, Namespace, ClusterName],
                [PodName, Namespace, ClusterName],
                [ClusterName],
              ]
            metric_name_selectors:
              - pod_cpu_reserved_capacity
              - pod_memory_reserved_capacity
          - dimensions:
              [
                [FullPodName, PodName, Namespace, ClusterName],
                [PodName, Namespace, ClusterName],
              ]
            metric_name_selectors:
              - pod_number_of_container_restarts

          # container metrics
          - dimensions:
              [
                [FullPodName, PodName, Namespace, ClusterName, ContainerName],
                [PodName, Namespace, ClusterName, ContainerName],
                [Namespace, ClusterName, ContainerName],
                [ClusterName, ContainerName],
              ]
            metric_name_selectors:
              - container_cpu_utilization
              - container_memory_utilization
              - number_of_container_restarts

          # cluster metrics
          - dimensions: [[ClusterName]]
            metric_name_selectors:
              - cluster_node_count
              - cluster_failed_node_count

          # service metrics
          - dimensions: [[Service, Namespace, ClusterName], [ClusterName]]
            metric_name_selectors:
              - service_number_of_running_pods

          # node fs metrics
          - dimensions: [[NodeName, InstanceId, ClusterName], [ClusterName]]
            metric_name_selectors:
              - node_filesystem_utilization

          # namespace metrics
          - dimensions: [[Namespace, ClusterName], [ClusterName]]
            metric_name_selectors:
              - namespace_number_of_running_pods

    extensions:
      health_check: {}

    service:
      pipelines:
        metrics:
          receivers: [awscontainerinsightreceiver]
          processors: [batch/metrics]
          exporters: [awsemf/performance]
      extensions: [health_check]

  securityContext:
    runAsUser: 0
    runAsGroup: 0

  env:
    - name: K8S_NODE_NAME
      valueFrom:
        fieldRef:
          fieldPath: spec.nodeName
    - name: HOST_IP
      valueFrom:
        fieldRef:
          fieldPath: status.hostIP
    - name: HOST_NAME
      valueFrom:
        fieldRef:
          fieldPath: spec.nodeName
    - name: K8S_NAMESPACE
      valueFrom:
        fieldRef:
          fieldPath: metadata.namespace
    - name: "K8S_POD_NAME"
      valueFrom:
        fieldRef:
          fieldPath: "metadata.name"
  volumeMounts:
    - name: rootfs
      mountPath: /rootfs
      readOnly: true
    - name: dockersock
      mountPath: /var/run/docker.sock
      readOnly: true
    - name: containerdsock
      mountPath: /run/containerd/containerd.sock
    - name: varlibdocker
      mountPath: /var/lib/docker
      readOnly: true
    - name: sys
      mountPath: /sys
      readOnly: true
    - name: devdisk
      mountPath: /dev/disk
      readOnly: true
  volumes:
    - name: rootfs
      hostPath:
        path: /
    - name: dockersock
      hostPath:
        path: /var/run/docker.sock
    - name: varlibdocker
      hostPath:
        path: /var/lib/docker
    - name: containerdsock
      hostPath:
        path: /run/containerd/containerd.sock
    - name: sys
      hostPath:
        path: /sys
    - name: devdisk
      hostPath:
        path: /dev/disk/
We can review this in several parts to make better sense of it.
  image: public.ecr.aws/aws-observability/aws-otel-collector:v0.40.0
  mode: daemonset
The OpenTelemetry collector can run in several different modes depending on the telemetry it is collecting. In this case we'll run it as a DaemonSet so that a pod runs on each node in the EKS cluster. This allows us to collect telemetry from the node and container runtime.
Next we can start to break down the collector configuration itself.
  config:
    receivers:
      awscontainerinsightreceiver:
        add_full_pod_name_metric_label: true
First we'll configure the AWS Container Insights Receiver to collect metrics from the node.
    processors:
      batch/metrics:
        timeout: 60s
Next we'll use a batch processor to reduce the number of API calls to CloudWatch by flushing metrics buffered over at most 60 seconds.
    exporters:
      awsemf/performance:
        namespace: ContainerInsights
        log_group_name: "/aws/containerinsights/${EKS_CLUSTER_NAME}/performance"
And now we'll use the AWS CloudWatch EMF Exporter for OpenTelemetry Collector to convert the OpenTelemetry metrics to AWS CloudWatch Embedded Metric Format (EMF) and then send them directly to CloudWatch Logs using the PutLogEvents API. The log entries will be sent to the CloudWatch Logs log group shown and use the metrics will appear in the ContainerInsights namespace. This rest of this section is too long to view in full but see the complete manifest above.
      pipelines:
        metrics:
          receivers: [awscontainerinsightreceiver]
          processors: [batch/metrics]
          exporters: [awsemf/performance]
Finally we need to use an OpenTelemetry pipeline to combine our receiver, processor and exporter.
We'll use the managed IAM policy CloudWatchAgentServerPolicy to provide the collector with the IAM permissions it needs via IAM Roles for Service Accounts to send the metrics to CloudWatch:
{"AttachedPolicies": [
{"PolicyName": "CloudWatchAgentServerPolicy",
"PolicyArn": "arn:aws:iam::aws:policy/CloudWatchAgentServerPolicy"
}
]
}
This IAM role will be added to the ServiceAccount for the collector:
apiVersion: v1
kind: ServiceAccount
metadata:
  name: adot-collector-ci
  annotations:
    eks.amazonaws.com/role-arn: ${ADOT_IAM_ROLE_CI}
Create the resources we've explored above:
We can confirm that our collector is running by inspecting the Pods created by the DaemonSet:
NAME READY STATUS RESTARTS AGE
adot-container-ci-collector-5lp5g 1/1 Running 0 15s
adot-container-ci-collector-ctvgs 1/1 Running 0 15s
adot-container-ci-collector-w4vqs 1/1 Running 0 15s
This shows the collector is running and collecting metrics from the cluster. To view metrics first open the CloudWatch console and navigate to Container Insights:
Please note that:
- It may take a few minutes for data to start appearing in CloudWatch
- It is expected that some metrics are missing since they are provided by the CloudWatch agent with enhanced observability
 Open CloudWatch console
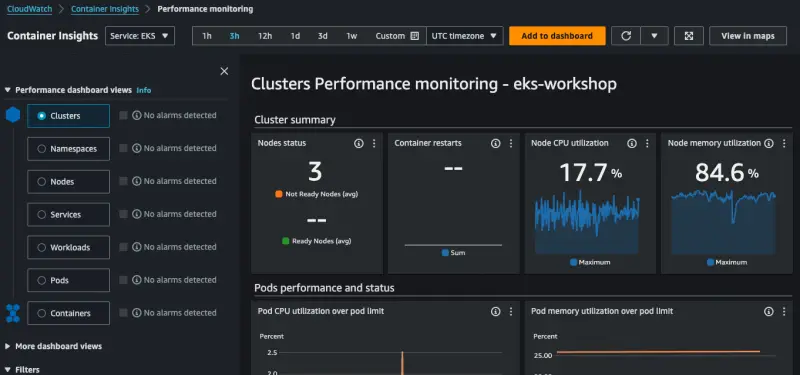
You can take some time to explore around the console to see the various ways that metrics are presented such as by cluster, namespace or pod.