Kubernetes events
This section demonstrates how we can export Kubernetes events to OpenSearch and use OpenSearch to improve observability of the EKS cluster. We'll deploy the Kubernetes events exporter to forward events to OpenSearch, generate additional Kubernetes events by creating test workloads, explore the OpenSearch Kubernetes events dashboard, identify issues and optionally explore events within the Kubernetes cluster
Kubernetes Events provide a rich source of information that can be used to monitor applications and cluster state, respond to failures and perform diagnostics. Events generally denote some state change. Examples include pod creation, adding replicas and scheduling resources. Each event includes a type field which is set to Normal or Warning to indicate success of failure.
You've already worked with Kubernetes events if you have ever run kubectl describe on a resource. As shown below the last section of output from kubectl describe displays the Kubernetes events related to the resource.
kubectl describe pod nginx
...
Events:
  Type    Reason     Age   From               Message
  ----    ------     ----  ----               -------
  Normal  Scheduled  5s    default-scheduler  Successfully assigned default/nginx to ip-10-42-179-183.us-west-2.compute.internal
  Normal  Pulling    4s    kubelet            Pulling image "nginx"
  Normal  Pulled     4s    kubelet            Successfully pulled image "nginx" in 627.545722ms (627.553403ms including waiting)
  Normal  Created    4s    kubelet            Created container nginx
  Normal  Started    3s    kubelet            Started container nginx
Kubernetes events are continuously generated but retained within the cluster for only one hour. This retention period is consistent with the Kubernetes upstream default event time-to-live (TTL) of 60 minutes. OpenSearch provides a durable store that simplifies collection, analysis and visualization of these events.
The following diagram provides an overview of the setup for this section. kubernetes-events-exporter will be deployed in the opensearch-exporter namespace to forward events to the OpenSearch domain. Events are stored in the eks-kubernetes-events index in OpenSearch. An OpenSearch dashboard that we loaded earlier is used to visualize the events.

Deploy Kubernetes events exporter and configure it to send events to our OpenSearch domain. The base configuration is available here. The OpenSearch credentials we retrieved earlier are being used to configure the exporter. The second command verifies that the Kubernetes events pod is running.
...
NAME: events-to-opensearch
LAST DEPLOYED: Fri Oct 20 01:04:56 2023
NAMESPACE: opensearch-exporter
...
NAME READY STATUS RESTARTS AGE
events-to-opensearch-kubernetes-event-exporter-67fc698978-2f9wc 1/1 Running 0 10s
Now we'll generate additional Kubernetes events by launching three deployments labelled scenario-a, scenario-b and scenario-c within the test namespace to demonstrate Normal and Warning events. Each deployment intentionally includes an error.
namespace/test created
secret/some-secret created
deployment.apps/scenario-a created
deployment.apps/scenario-b created
deployment.apps/scenario-c created
The Kubernetes events exporter we launched in the previous step sends events from the last hour and any new ones to OpenSearch. Therefore, the exact list of events we see when we run the following commands and inspect the OpenSearch dashboard will vary depending on the EKS cluster activity within the last hour.
Explore the OpenSearch Kubernetes events dashboard by returning to the OpenSearch dashboard that we used in the previous page. Access the Kubernetes events dashboard from the dashboard landing page we saw earlier or use the command below to obtain its coordinates:
Kubernetes Events dashboard: <OpenSearch Dashboard URL>
Username: <user name>
Password: <password>
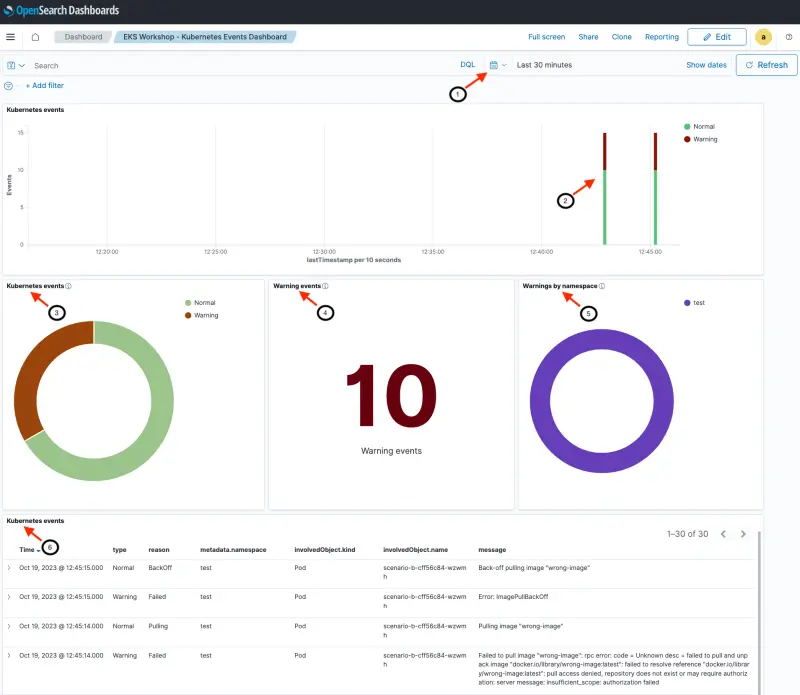
The live dashboard should look similar to the image below but the numbers and messages will vary depending on cluster activity. An explanation of the dashboards sections and fields follows.
- [Header] Shows date / time range. We can customize the time range that we are exploring with this dashboard (Last 30 minutes in this example)
- [Top section] Date histogram of events (split between Normal and Warning events)
- [Middle section] Kubernetes events shows the total number of events (Normal and Warning)
- [Middle section] Warning events seen during the selected time interval.
- [Middle section] Warnings broken out by namespace. All the warnings are in the
testnamespace in this example - [Bottom section] Detailed events and messages with most recent event first
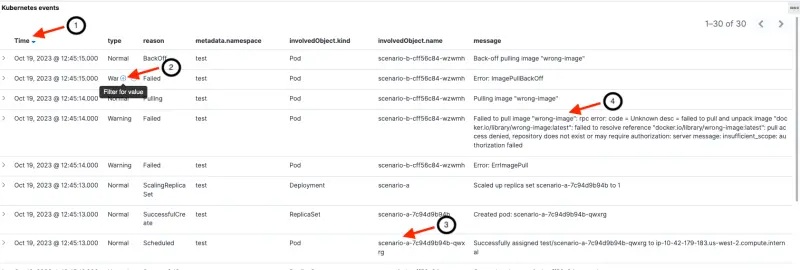
The next image focuses on the bottom section with event details including:
- Last timestamp for the event
- Event type (normal or warning). Notice that hovering our mouse over a field enables us to filter by that value (e.g. filter for Warning events)
- Name of Kubernetes resource (along with the object type and namespace)
- Human readable message
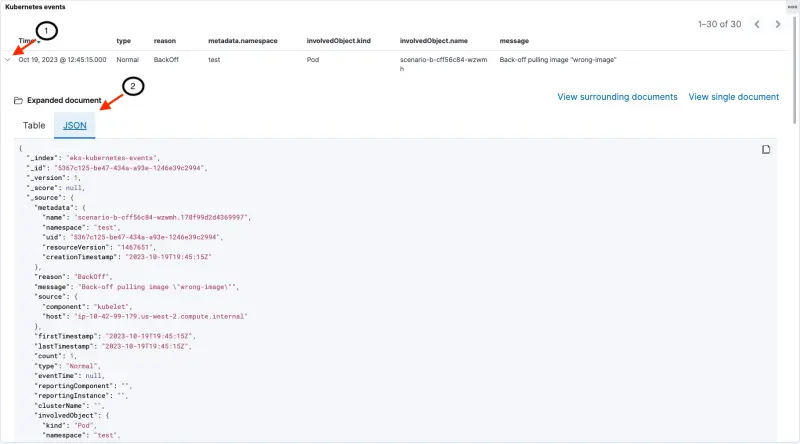
We can drill down into the full event details as shown in the following image:
- Clicking on the '>' next to each event opens up a new section
- The full event document can be viewed as a table or in JSON format
An explanation of data fields within Kubernetes events can be found on kubernetes.io or by running kubectl explain events.
We can use the Kubernetes events dashboard to identify why the three deployments (scenario-a, scenario-b and scenario-c) are experiencing issues. All the pods we deployed earlier are in the test namespace.
scenario-a: From the dashboard we can see that scenario-a has a reason of FailedMount and the message MountVolume.SetUp failed for volume "secret-volume" : secret "misspelt-secret-name" not found. The pod is attempting to mount a secret that does not exist.

scenario-b: scenario-b has failed with a message Failed to pull image "wrong-image": rpc error: code = Unknown desc = failed to pull and unpack image "docker.io/library/wrong-image:latest": failed to resolve reference "docker.io/library/wrong-image:latest": pull access denied, repository does not exist or may require authorization: server message: insufficient_scope: authorization failed. The pod is not getting created because it references a non-existent image.

scenario-c: The dashboard shows a reason of FailedScheduling and the message 0/3 nodes are available: 3 Insufficient cpu. preemption: 0/3 nodes are available: 3 No preemption victims found for incoming pod. This deployment is requesting CPU that exceeds what any of the current cluster nodes can provide. (We do not have any of the cluster autoscaling capabilities enabled within this module of EKS workshop.)

Fix the issues and revisit OpenSearch dashboard to see changes
namespace/test unchanged
secret/some-secret unchanged
deployment.apps/scenario-a configured
deployment.apps/scenario-b configured
deployment.apps/scenario-c configured
Go back to the OpenSearch dashboard and notice that the earlier issues have been resolved. The updated deployment launches new pods that are successful and the pods created earlier (with errors) are deleted.
As issues are fixed, a new set of Normal Kubernetes events are generated. The earlier events (Normal or Warning) remain as part of the history. Therefore the number of Normal and Warning events always increases.
We can optionally explore Kubernetes events from within the EKS cluster. The events we were exploring from within the OpenSearch dashboard mirror the information that is available within the cluster.
Retrieve the five most recent events in the cluster.
NAMESPACE LAST SEEN TYPE REASON OBJECT MESSAGE
catalog 44m Normal SuccessfulCreate replicaset/catalog-857f89d57d Created pod: catalog-857f89d57d-xl4xc
assets 44m Normal Scheduled pod/assets-7ccc84cb4d-k5btz Successfully assigned assets/assets-7ccc84cb4d-k5btz to ip-10-42-153-25.us-west-2.compute.internal
orders 44m Normal Scheduled pod/orders-5696b978f5-gk2d7 Successfully assigned orders/orders-5696b978f5-gk2d7 to ip-10-42-104-177.us-west-2.compute.internal
ui 44m Normal Scheduled pod/ui-5dfb7d65fc-7l94z Successfully assigned ui/ui-5dfb7d65fc-7l94z to ip-10-42-190-29.us-west-2.compute.internal
See events with a warning or failed status.
NAMESPACE LAST SEEN TYPE REASON OBJECT MESSAGE
orders 44m Warning Unhealthy pod/orders-5696b978f5-gk2d7 Readiness probe failed: Get "http://10.42.127.4:8080/actuator/health/liveness": dial tcp 10.42.127.4:8080: connect: connection refused
test 7m6s Warning FailedScheduling pod/scenario-c-6d988b8d84-gghjv 0/3 nodes are available: 3 Insufficient cpu. preemption: 0/3 nodes are available: 3 No preemption victims found for incoming pod.
test 6m39s Warning Failed pod/scenario-b-cff56c84-xn9hh Error: ImagePullBackOff
test 6m28s Warning Failed pod/scenario-b-cff56c84-xn9hh Failed to pull image "wrong-image": rpc error: code = Unknown desc = failed to pull and unpack image "docker.io/library/wrong-image:latest": failed to resolve reference "docker.io/library/wrong-image:latest": pull access denied, repository does not exist or may require authorization: server message: insufficient_scope: authorization failed
See the most recent event (across all namespaces) in JSON format. Notice that the output is very similar to the details found within the OpenSearch index. (The Opensearch document has additional fields to facilitate indexing within OpenSearch).
{"apiVersion": "v1",
"count": 1,
"eventTime": null,
"firstTimestamp": "2023-10-19T21:49:44Z",
"involvedObject": {"apiVersion": "apps/v1",
"kind": "Deployment",
"name": "scenario-c",
"namespace": "test",
"resourceVersion": "1485908",
"uid": "7b12f29b-2c83-4b3b-8aa3-a4c8b22d8a38"
},
"kind": "Event",
"lastTimestamp": "2023-10-19T21:49:44Z",
"message": "Scaled down replica set scenario-c-6d988b8d84 to 0 from 1",
"metadata": {"creationTimestamp": "2023-10-19T21:49:44Z",
"name": "scenario-c.178fa09ddad7c5e3",
"namespace": "test",
"resourceVersion": "1485955",
"uid": "e56aa6b2-9808-45a8-8863-ec9112f23822"
},
"reason": "ScalingReplicaSet",
"reportingComponent": "deployment-controller",
"reportingInstance": "",
"source": {"component": "deployment-controller"
},
"type": "Normal"
}